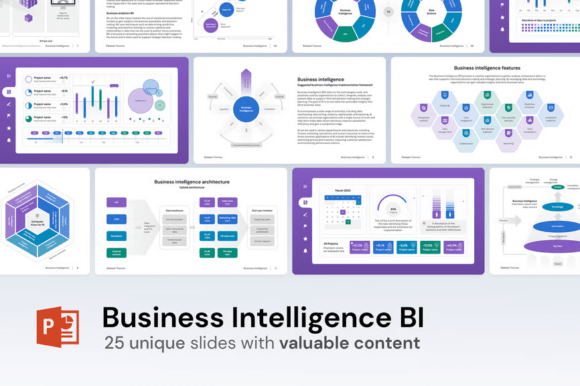
Transform Data into Decisions: Business Intelligence BI for PowerPoint
In the modern business landscape, data is only as valuable as the insights you can extract and communicate. For professionals ranging from entrepreneurs to corporate strategists, the challenge isn't always gathering data—it's presenting it in a way that drives action. This is where Business Intelligence BI for PowerPoint becomes an indispensable asset. It's not merely a collection of slides; it's a comprehensive visual framework designed to turn complex datasets into clear, compelling narratives.
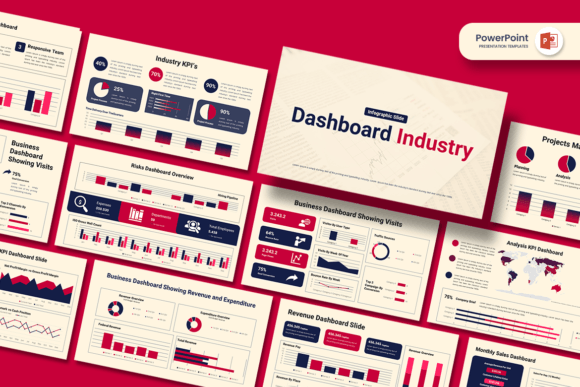
This template package is built for the decision-maker who needs to move beyond static reports. It includes 20 unique slides focused on core BI concepts—like the BI implementation framework, architecture schemes, and real-time decision-making processes—alongside 5 modern dashboard templates. The visual style is clean, professional, and inherently modern, utilizing editable shapes and a structured layout that guides the viewer's eye. Think of it as the architectural blueprint for your data story, where every element from the color theme to the iconography is purpose-built for clarity and impact.
Where Strategy Meets Presentation: Practical Applications
The true power of this BI toolkit lies in its versatility. It's a design asset that serves multiple functions across an organization. For a marketing manager, the dashboard templates are perfect for presenting campaign performance metrics and customer analytics to stakeholders. A startup founder can use the "BI Strategy 10-Step Framework" slide to secure investor buy-in, visually mapping out their data governance and analytics roadmap. For internal consultants or project managers, the "Business Intelligence Architecture" and "Hybrid Architecture" slides provide the perfect visual shorthand to explain complex technical ecosystems to non-technical teams.
Consider the "Computer Vision CV for Business Intelligence BI" slide. This isn't just a diagram; it's a conversation starter for teams exploring advanced analytics. Similarly, the "Advanced Analytics vs Business Intelligence" comparison slide helps clarify strategic priorities during planning sessions. The template's strength is in its ability to make abstract concepts tangible. The Modern Style and 16x9HD, Retina Ready format ensure that whether you're presenting on a large conference screen or sharing a PDF over email, the professionalism of your message remains intact.
Designing for Impact: The Editable Advantage
One of the most significant pain points in professional presentation design is customization. A beautifully designed slide is useless if it can't be adapted to your brand's identity. This is where the Business Intelligence BI for PowerPoint template excels with its Only editable shapes philosophy. You don't need Photoshop or Illustrator to make it your own. Every chart, icon, and text box is a native PowerPoint shape, allowing you to resize, recolor, and reposition elements with just a couple of clicks.
The inclusion of 10 pre-made color themes (XML files) is a game-changer for brand consistency. You can apply a sophisticated, cohesive color palette to the entire deck instantly, or spend two minutes creating your own custom theme to match your company's brand guidelines. This feature ensures that your brand identity is front and center, enhancing recognition and professionalism. The use of free Google fonts further simplifies the process, eliminating licensing headaches while providing access to clean, modern typography that enhances readability across all slides.
Maximizing Your Data Narrative: Tips for Effective Use
To get the most out of this toolkit, think beyond the individual slides. Use the BI Framework reporting and analysis slide as a cornerstone for your quarterly business reviews. Pair the Real-time decision making infographic with live data screenshots to create a dynamic, evidence-based argument for new initiatives. The key is to use the templates as a scaffold for your own story, not as a rigid script.
When evaluating the template for a specific project, consider the flow of information. Start with the "What is Business Intelligence" slide to establish a common understanding, then move into the "Business Intelligence Process" to outline your methodology. Use the dashboard templates to showcase results and the architecture slides to discuss future scalability. This creates a logical narrative arc that leads your audience from context to conclusion. Remember, the goal of business intelligence reporting is not just to inform, but to persuade and align. This template provides the visual language to do exactly that, making complex data accessible and actionable for every stakeholder in the room.